Prilixor

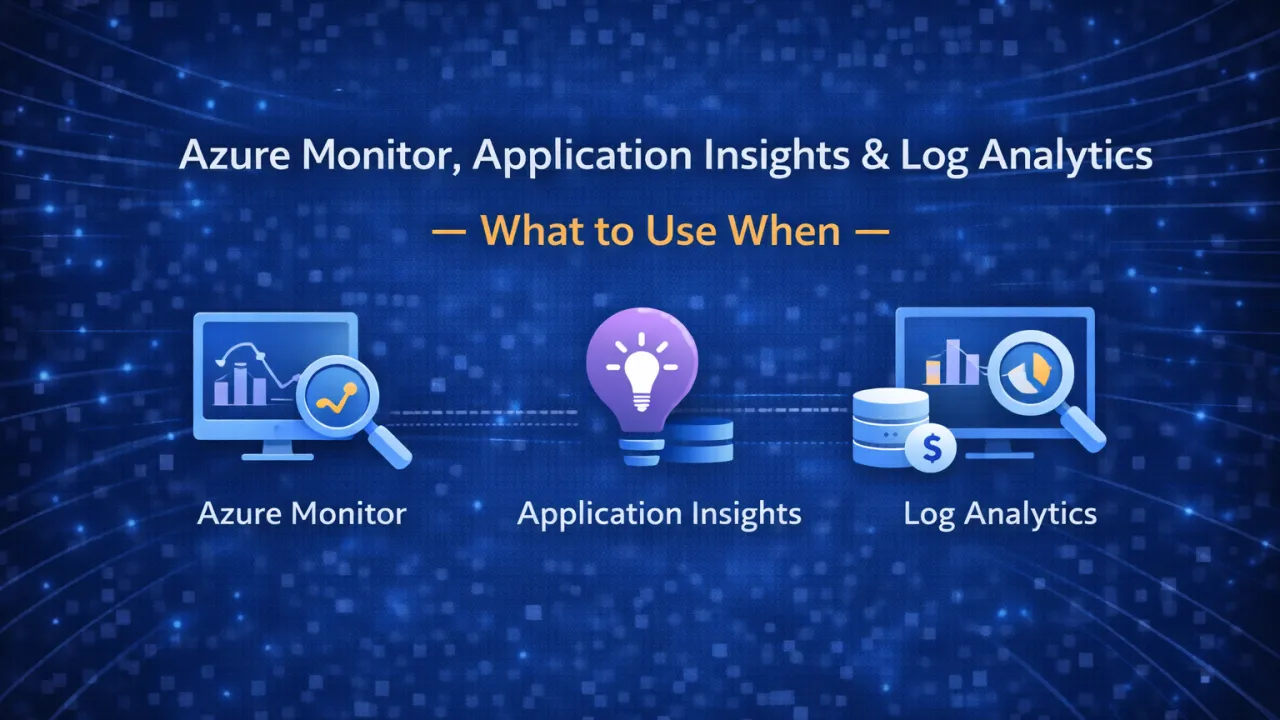
Azure Monitor, Application Insights & Log Analytics – What to Use When

Observability in Azure often confuses even experienced developers. You hear terms like Azure Monitor, Application Insights, and Log Analytics — and they seem overlapping.

The result?

Many teams either: • Use everything without clarity • Or use the wrong tool for the job

The key is simple: Understand what each tool is designed for.

The Big Picture

Think of it like this:

  • Azure Monitor → The umbrella platform • Application Insights → Application-level monitoring • Log Analytics → Querying and analyzing data

They are not competitors — they work together.

Azure Monitor – The Foundation

Azure Monitor is the central platform that collects and organizes telemetry across Azure.

It handles:

  • Metrics (CPU, memory, requests) • Logs from resources • Alerts and dashboards • Integration with other monitoring tools

You don’t “choose” Azure Monitor — you are already using it whenever you monitor Azure resources.

Application Insights – For Your Application

Application Insights is focused on application performance monitoring (APM).

Use it when you want to understand:

  • Request performance • Dependency calls (DB, APIs) • Failures and exceptions • User behavior and usage patterns • Distributed tracing

It is ideal for:

  • APIs • Web apps • Microservices

If you care about how your code behaves, this is your tool.

Log Analytics – For Deep Analysis

Log Analytics is where you query and analyze logs using KQL (Kusto Query Language).

Use it when you need:

  • Advanced querying across multiple services • Correlating logs from different resources • Debugging complex production issues • Custom dashboards and reports

It’s not about collecting data — it’s about making sense of it.

How They Work Together

In a typical setup:

  • Application Insights collects app-level telemetry • Azure Monitor aggregates platform-level data • Log Analytics allows you to query everything in one place

This combination provides full observability.

When to Use What

Use Application Insights when: • You want request tracing and performance insights • You need visibility into application behavior

Use Log Analytics when: • You need cross-service log analysis • You want to run complex queries

Use Azure Monitor when: • You want alerts, metrics, and overall monitoring • You need a unified monitoring layer

Common Mistakes

Many teams:

  • Treat them as separate tools instead of a system • Ignore Log Analytics and rely only on dashboards • Don’t configure proper alerts • Miss correlation between logs and traces

Observability fails not because of tools — but because of how they are used.

The Real Insight

Monitoring is not about collecting data. It’s about understanding your system under real conditions.

Azure gives you powerful tools — but clarity comes from knowing their roles.

Final Thought

In modern cloud systems:

  • Metrics tell you something is wrong • Logs tell you what happened • Traces tell you where it happened

Together, they give you control.

Observability in .NET Using OpenTelemetry (Logs, Traces, Metrics)

In modern distributed systems, performance problems rarely announce themselves clearly. A slow request might be caused by a downstream service, a database bottleneck, thread starvation, memory pressure, or network latency. Without proper visibility, diagnosing such issues becomes guesswork.

This is where observability becomes essential.

Observability is not just logging. It is the ability to understand what your system is doing internally by analyzing three core signals: logs, traces, and metrics. In the .NET ecosystem, OpenTelemetry has become the standard approach for implementing unified observability across services.

Why Observability Matters in Distributed .NET Systems

As applications evolve into microservices and cloud-native architectures, traditional debugging methods no longer work. You cannot simply attach a debugger in production. Failures span multiple services, and performance degradation often occurs under load.

Observability enables you to:

  • Identify latency bottlenecks • Trace request flow across services • Detect abnormal memory or CPU patterns • Monitor error rates and failure spikes • Correlate issues across distributed components

Without observability, scaling safely becomes nearly impossible.

The Three Pillars: Logs, Traces, Metrics

1️ Logs

Logs provide detailed event-level information. They capture application behavior, warnings, errors, and contextual data. Structured logging is critical — plain text logs limit analysis capabilities.

2️ Traces

Traces follow a request’s journey across multiple services. In distributed .NET systems, a single HTTP request may trigger database queries, external API calls, and background jobs. Distributed tracing connects these operations under a shared correlation ID.

3️ Metrics

Metrics provide aggregated numerical insights over time. Examples include request duration, CPU usage, memory consumption, GC collections, and request-per-second counts. Metrics help detect trends and anomalies quickly.

Each signal answers a different question:

  • Logs explain what happened
  • Traces show where it happened
  • Metrics reveal how often and how severe

Together, they provide full visibility.

OpenTelemetry in .NET

OpenTelemetry standardizes how telemetry data is collected and exported. Instead of using disconnected monitoring tools, developers can instrument applications once and export data to multiple observability platforms.

In .NET, OpenTelemetry integrates seamlessly with:

  • ASP.NET Core request pipelines • HttpClient calls • Database operations • Background services • Custom application logic

It allows automatic instrumentation while also supporting manual tracing for critical operations.

This unified model reduces vendor lock-in and promotes consistent monitoring practices across services.

Best Practices for Production Observability

Simply enabling logging is not enough. Production-ready observability requires discipline:

  • Use structured logging with contextual properties • Ensure trace propagation across service boundaries • Monitor high-value metrics like P95 latency and error rates • Avoid excessive log verbosity in high-traffic systems • Set alerts based on meaningful thresholds • Continuously review telemetry under load

Observability should be proactive, not reactive.

The Strategic Advantage

Teams that implement strong observability resolve incidents faster, scale more confidently, and maintain higher reliability. Instead of reacting blindly to production issues, they rely on measurable system signals.

In modern .NET architecture, observability is not an optional enhancement. It is a foundational requirement for building resilient, high-performance distributed systems.

You cannot optimize what you cannot measure. And you cannot measure what you cannot observe.

Monitoring Your Azure Deployments: Key Metrics and Tools for Health & Performance

Cloud adoption has transformed how applications are deployed and scaled, but it has also introduced new complexities. In Microsoft Azure, applications are often distributed across multiple services — from Azure App Service and Virtual Machines to Kubernetes clusters and serverless functions. With this complexity, monitoring becomes the backbone of reliability, ensuring that deployments remain healthy, performant, and cost-efficient.

Monitoring is no longer just about checking uptime; it’s about tracking key metrics, identifying anomalies in real time, and proactively addressing issues before they impact end users. Azure provides a rich ecosystem of tools and services that empower developers, DevOps teams, and businesses to achieve just that.

Key Metrics to Track in Azure Deployments

Monitoring is most effective when you know what to measure. Some of the critical categories include:

  1. Availability Metrics
  2. Performance Metrics
  3. Resource Utilization Metrics
  4. Application-Specific Metrics

Tracking these metrics consistently provides visibility into system health and user experience, while also optimizing cloud spending by avoiding over- or under-provisioned resources.

Core Azure Monitoring Tools

Azure provides a tightly integrated toolset for monitoring every layer of your deployment, from infrastructure to application code.

1. Azure Monitor

Azure Monitor acts as the central hub for observability in Azure. It collects data from VMs, containers, databases, and PaaS resources, consolidating it into dashboards and logs. Its key strengths are:

  • Unified metrics and log collection across the Azure ecosystem.
  • Integration with alerting systems for proactive notifications.
  • Custom dashboards to visualize KPIs at infrastructure or application level.

2. Application Insights

For developers, Application Insights is the most powerful tool. It provides application performance monitoring (APM), with insights such as:

  • Request response times, dependency tracking, and error diagnostics.
  • End-to-end transaction tracing, even across microservices.
  • Real-time user telemetry, such as session duration and geographic traffic.
  • Integration with .NET, Java, Node.js, and Python applications.

This enables teams to catch performance degradations, API slowdowns, and unhandled exceptions quickly.

3. Log Analytics

Log Analytics is the query engine behind Azure Monitor. It allows teams to dig deep into telemetry data with Kusto Query Language (KQL). Examples include:

  • Analyzing patterns in failed logins for security monitoring.
  • Detecting anomalies in request rates.
  • Correlating application logs with infrastructure failures.

4. Alerts and Dashboards

To make monitoring actionable, Azure enables:

  • Automated alerts that trigger based on thresholds (e.g., CPU > 80%, error rate > 5%).
  • Smart alerts powered by machine learning to detect unusual patterns.
  • Custom dashboards for NOC (Network Operations Center) or DevOps teams.

This ensures that issues are identified before customers notice them, reducing downtime and improving SLA adherence.

Best Practices for Developers and Teams

Monitoring tools are only effective if paired with best practices:

  • Define SLIs, SLOs, and SLAs: Service Level Indicators (SLIs) and Objectives (SLOs) guide what metrics matter most. For example, “99.9% uptime” may translate into strict error-rate and latency monitoring.
  • Integrate monitoring with CI/CD pipelines: Ensuring every new deployment is validated with synthetic tests and telemetry integration.
  • Tag and organize resources: Proper resource tagging improves observability across environments (dev, test, production).
  • Enable distributed tracing: Especially critical in microservices and serverless architectures.
  • Set proactive alerts: Don’t wait for customer complaints — configure alerts for unusual traffic spikes, error surges, or resource drains.

When Things Go Wrong: Root Cause Analysis

No deployment is perfect, and failures are inevitable. Monitoring helps reduce MTTR (Mean Time to Recovery) by:

  • Correlating application failures with infrastructure events.
  • Identifying whether an issue stems from code changes, external dependencies, or resource exhaustion.
  • Providing developers with full visibility into the chain of events leading to downtime.

This accelerates incident resolution and fosters a culture of continuous improvement.

Conclusion

In today’s cloud-driven ecosystem, monitoring is more than an operational requirement; it is a strategic advantage. With Azure Monitor, Application Insights, and Log Analytics, organizations gain comprehensive visibility into system health, performance, and user experience.

By tracking the right metrics, adopting best practices, and integrating monitoring into the DevOps lifecycle, teams can transform their Azure deployments from reactive to proactive — delivering reliable, scalable, and high-performing applications that meet user expectations and business goals.

Containerizing .NET Apps for Azure: Docker to Azure Container Apps/AKS

The way applications are built and deployed has changed dramatically in the last decade. For .NET developers, containerization has become one of the most powerful approaches to building modern, cloud-ready applications. By packaging an application and its dependencies into a single lightweight unit, containers provide a level of portability, consistency, and scalability that traditional deployment models cannot match.

Why Containerization Matters for .NET Developers

Traditionally, .NET applications were tied to Windows environments, which often led to challenges in deployment and scaling. With the evolution of .NET Core and now .NET 6/7/8, the framework became truly cross-platform, enabling developers to run applications inside Docker containers on Windows, Linux, or macOS.

This shift allows teams to:

  • Run anywhere: Whether on a local developer machine, staging environment, or production in the cloud, the application behaves the same way.
  • Scale effortlessly: Containers are lightweight, start quickly, and can scale horizontally to meet demand.
  • Ensure consistency: Dependencies, frameworks, and runtime are bundled inside the container, reducing “works on my machine” problems.
  • Align with DevOps: Containerization integrates naturally with CI/CD pipelines, enabling automated testing, building, and deployment.

Azure’s Container Ecosystem

Microsoft Azure provides a rich set of container services tailored to different workloads. Two of the most popular options for .NET developers are Azure Container Apps and Azure Kubernetes Service (AKS).

  • Azure Container Apps: Designed for simplicity and flexibility, it’s ideal for developers who want to focus on code rather than infrastructure. It supports autoscaling, event-driven architectures, and microservices without requiring deep Kubernetes expertise.
  • Azure Kubernetes Service (AKS): A fully managed Kubernetes offering that provides advanced orchestration for complex, large-scale workloads. It’s best suited for organizations running multiple microservices, needing granular networking, or requiring enterprise-grade control and resilience.

Both services integrate seamlessly with Azure Container Registry (ACR), which acts as a secure storage for container images.

Containerization Benefits in Practice

For .NET applications, containerization delivers tangible advantages across the software lifecycle:

  1. Portability – A containerized .NET app can move effortlessly between on-premises servers, developer laptops, and Azure cloud services without reconfiguration.
  2. Performance and Efficiency – Containers share the host OS kernel, making them more resource-efficient compared to traditional virtual machines.
  3. Faster Deployments – Deployments become faster and more reliable since containers are immutable units. Rollbacks and blue-green deployments are easier to implement.
  4. Microservices Ready – Containers are the foundation for building microservices-based architectures, where each service can scale independently.
  5. Integration with Azure Services – Containerized .NET apps can easily consume services like Azure SQL Database, Cosmos DB, Key Vault, and Application Insights.

Choosing Between Container Apps and AKS

  • If your team values developer productivity, faster go-to-market, and serverless scaling, Azure Container Apps is often the best choice. It abstracts away infrastructure while giving you powerful scaling options.
  • If your application landscape is large, complex, and requires advanced orchestration or multi-container deployments, AKS is more suitable. It offers full Kubernetes capabilities while offloading cluster management to Azure.

The Developer Advantage

For .NET teams, embracing containerization is not just a technical upgrade but a cultural shift. It enables developers to:

  • Work in consistent environments regardless of operating system.
  • Collaborate more effectively across development, testing, and operations.
  • Leverage modern DevOps practices such as continuous integration and continuous delivery.
  • Future-proof applications to run seamlessly in any cloud-native ecosystem.

Final Thoughts

Containerization has transformed how .NET applications are developed and deployed. By leveraging Docker along with Azure Container Apps or AKS, developers can ensure their applications are scalable, portable, and cloud-ready.

The choice between Container Apps and AKS depends on the level of complexity and control needed — but in both cases, containerization empowers .NET developers to build modern applications that thrive in today’s fast-moving digital landscape.

Azure DevOps for .NET Teams: Accelerating Your Development Lifecycle

Modern software delivery is no longer just about writing clean code — it’s about how fast you can plan, build, test, and release while maintaining reliability. For .NET teams, Azure DevOps provides an integrated platform that brings planning, coding, testing, and deployment together in one ecosystem, tightly integrated with Visual Studio, C#, and Azure services.

In this article, we’ll break down each part of the .NET application lifecycle and explore how Azure DevOps helps accelerate delivery.

1. Planning & Work Management with Azure Boards

Every .NET project begins with requirements and backlog organization. Azure Boards gives teams visibility and control with tools like:

  • Epics, Features, and User Stories → Define business needs in layers that developers can consume.
  • Agile methodologies support → Scrum, Kanban, or hybrid boards to match team workflows.
  • Backlog Prioritization → Teams can drag and drop tasks, prioritize bug fixes, and ensure dependencies are addressed before sprint planning.
  • Dashboards & Analytics → Burndown charts, velocity tracking, and team capacity planning ensure transparency.

💡 Example: A .NET Core eCommerce team could track new checkout features as Epics, link them to user stories (e.g., “As a customer, I want to pay with PayPal”), and assign developer tasks such as implementing the API integration.

👉 Developer Advantage: Developers see exactly what’s needed, aligned to business value, reducing wasted effort.

2. Source Control & Collaboration with Azure Repos

Version control is the foundation of modern DevOps. With Azure Repos, .NET teams get:

  • Unlimited private Git repos (or TFVC for legacy).
  • Branching strategies → Support for GitFlow, trunk-based, or feature branching.
  • Pull Requests with Policies → Enforce minimum reviewers, build validations, and linked work items before merging.
  • Code Search → Find methods, classes, or NuGet references across large codebases.
  • Integration with IDEs → Visual Studio and VS Code provide native Git support with direct Azure Repos connectivity.

💡 Example: A financial services team developing an ASP.NET Core API can enforce PR policies so that each commit triggers a build and unit test suite before merging to main.

👉 Developer Advantage: Cleaner code, fewer conflicts, and confidence that all merges are production-ready.

3. Continuous Integration (CI) with Azure Pipelines

Automated builds are crucial for speeding up development cycles. Azure Pipelines provides:

  • Build Automation: Compile .NET projects, restore NuGet dependencies, and run unit tests automatically.
  • Cross-Platform Builds: Target Windows, Linux, macOS, and even containers with .NET 6/7/8.
  • Pipeline as Code (YAML): Store CI/CD definitions in Git for versioning and reusability.
  • Parallel Jobs: Run multiple builds/tests simultaneously to cut feedback time.
  • Integration with GitHub and Repos: Every commit or PR can trigger builds instantly.

💡 Example: A .NET Blazor project commits to feature/login-ui → triggers pipeline → builds app → runs Selenium tests → publishes build artifact.

👉 Developer Advantage: Immediate feedback when something breaks, reducing “integration hell.”

4. Continuous Delivery (CD) & Deployment Automation

Beyond CI, delivery pipelines ensure smooth, repeatable releases. With Azure Pipelines CD:

  • Multi-Stage Pipelines → Define environments (Dev → QA → UAT → Prod).
  • Approvals & Gates → Manual approvals or automated checks before promoting a release.
  • Environment Templates → Reuse deployment patterns across teams.
  • Integration with Azure Services: Deploy directly to Azure App Service, AKS, VMs, or Functions.
  • Infrastructure as Code (IaC): Provision environments with Bicep, ARM, or Terraform before deploying code.

💡 Example: A .NET API deployment pipeline → builds Docker image → pushes to Azure Container Registry → deploys to AKS cluster → runs smoke tests → waits for QA approval → rolls out to production.

👉 Developer Advantage: No more manual FTP uploads or deployment errors — everything is automated, consistent, and traceable.

5. Quality Assurance with Azure Test Plans

Testing is baked into Azure DevOps rather than treated as an afterthought. Azure Test Plans provide:

  • Manual Testing: Create step-by-step test cases and capture results.
  • Exploratory Testing: Test new features without scripts, logging bugs as you go.
  • Automated Test Integration: Run MSTest, NUnit, or xUnit inside CI/CD pipelines.
  • Defect Tracking: Bugs automatically link to Boards and commits for traceability.

💡 Example: When a .NET team adds a new checkout flow, QA creates exploratory test sessions in Test Plans, logging defects that developers see directly in Boards.

👉 Developer Advantage: Faster bug discovery and immediate feedback inside the same DevOps environment.

6. Package Management with Azure Artifacts

Modern .NET apps rely on reusable packages. Azure Artifacts helps by:

  • Hosting private NuGet feeds → Share common .NET libraries (e.g., logging, authentication modules).
  • Upstream Sources → Cache public packages from NuGet.org to reduce external dependency risks.
  • Versioning Control → Ensure apps use approved package versions only.

💡 Example: A microservices-based .NET project shares a reusable authentication package internally through Artifacts, preventing duplication and ensuring consistency.

👉 Developer Advantage: Dependency management is simplified, secure, and centralized.

7. Observability & Feedback Loops

Azure DevOps doesn’t stop at deployment. With integrations to Azure Monitor and Application Insights, .NET teams can:

  • Track performance metrics (response times, failure rates).
  • Monitor deployments for rollbacks.
  • Collect user feedback directly in Boards.

💡 Example: After deploying a new API version, telemetry shows a 20% increase in response time → rollback initiated → defect logged in Boards.

👉 Developer Advantage: Problems are caught early in production, before customers notice.

8. Best Practices for .NET Teams Adopting Azure DevOps

  • Adopt Git branching strategy → Choose GitFlow or trunk-based depending on release cadence.
  • Shift-left testing → Run unit and integration tests inside CI pipelines.
  • Automate deployments → Avoid manual releases — pipelines should handle Dev → Prod.
  • Leverage IaC → Use Bicep/Terraform to provision infrastructure alongside app code.
  • Use dashboards → Give visibility to product owners and stakeholders.
  • Integrate security checks → Add SAST/DAST scans in pipelines for DevSecOps readiness.

Conclusion

For .NET teams, Azure DevOps is not just a toolset — it’s a complete ecosystem that connects planning, coding, testing, and releasing into one streamlined workflow. By embracing Boards, Repos, Pipelines, Test Plans, and Artifacts, teams can:

✅ Deliver features faster ✅ Improve collaboration between devs, testers, and ops ✅ Reduce errors through automation ✅ Gain visibility across the entire lifecycle

In today’s competitive landscape, where speed and quality are non-negotiable, Azure DevOps ensures that .NET developers can move from idea to production with confidence.

Infrastructure as Code on Azure: Bicep vs. Terraform – A Developer’s Perspective

🔹 Introduction

As cloud adoption accelerates, Infrastructure as Code (IaC) has become the backbone of scalable, repeatable, and secure cloud operations. Instead of manually configuring infrastructure, developers now define it in code, ensuring consistency across environments.

When it comes to Microsoft Azure, two tools dominate the IaC conversation: Bicep and Terraform. Both serve the same purpose—automating infrastructure provisioning—but differ in syntax, ecosystem, and long-term adoption strategies.

So, which one should developers choose? Let’s break it down.

🔹 What is Azure Bicep?

Bicep is Microsoft’s domain-specific language (DSL) for deploying Azure resources. It acts as a simplified abstraction over ARM (Azure Resource Manager) templates, making deployments easier to write, read, and maintain.

Key Features of Bicep:

  • Native to Azure, tightly integrated with ARM
  • Cleaner syntax compared to JSON ARM templates
  • Automatic type validation for Azure resources
  • First-class support in Azure CLI & Azure PowerShell
  • No need for a state file (Azure handles state internally)

📌 Best for: Azure-focused teams who want simplicity, native integration, and minimal overhead.

🔹 What is Terraform?

Terraform, by HashiCorp, is a multi-cloud IaC tool that allows you to define infrastructure across providers (Azure, AWS, GCP, etc.) using its declarative HCL (HashiCorp Configuration Language).

Key Features of Terraform:

  • Multi-cloud and hybrid cloud support
  • Large community with thousands of reusable modules
  • Strong ecosystem with plugins (providers)
  • Requires managing a state file for tracking resources
  • Mature tool with wide enterprise adoption

📌 Best for: Organizations managing multi-cloud strategies or teams that want a standard IaC tool across environments.

🔹 Head-to-Head Comparison: Bicep vs. Terraform

FeatureBicepTerraformCloud SupportAzure-onlyMulti-cloudLearning CurveEasier for Azure devsSteeper, requires HCLEcosystemLimited (Azure-focused)Vast (multi-cloud modules)State ManagementManaged by AzureRequires external state mgmt (Azure Storage, Terraform Cloud, etc.)IntegrationNative Azure CLI/PowerShell supportWorks across multiple providersCommunityGrowing (Microsoft-backed)Mature, global adoption

🔹 When to Choose Bicep

✅ Your infrastructure is 100% Azure ✅ You want native Azure support with minimal setup ✅ Your team prefers a shorter learning curve ✅ You don’t want to manage state files

🔹 When to Choose Terraform

✅ You operate in a multi-cloud or hybrid environment ✅ Your organization already uses Terraform in other projects ✅ You want access to reusable community modules ✅ You need fine-grained control over state and deployments

🔹 Real-World Example

Imagine deploying a scalable web application:

  • With Bicep, you’d define Azure App Service, Azure SQL Database, and Azure Key Vault in a clean, Azure-native syntax.
  • With Terraform, you could define the same resources plus integrate AWS CloudFront or GCP Storage, all within the same IaC workflow.

🔹 Conclusion

Both Bicep and Terraform are powerful tools, but your choice depends on scope and strategy:

  • Bicep is the go-to for Azure-native teams seeking simplicity and direct integration.
  • Terraform shines when flexibility, multi-cloud adoption, and community-driven modules matter.

🚀 Ultimately, the right tool is the one that aligns with your cloud vision, team skills, and long-term infrastructure roadmap.

Mastering Azure Deployments: Strategies for Seamless CI/CD

In today’s software world, releasing code quickly is no longer enough. What truly matters is how reliably, securely, and repeatably you can move software from development to production.

As applications grow in complexity—with multiple environments, APIs, microservices, and third-party integrations—manual deployment processes become a bottleneck. They increase the risk of downtime, misconfigurations, and inconsistent environments.

This is why Continuous Integration and Continuous Deployment (CI/CD) on Azure is now the backbone of modern application delivery. A well-architected Azure CI/CD pipeline does far more than just “push code”: it creates a resilient, automated, and observable delivery process that supports both technical scalability and business agility.

🚀 Core Strategies for Azure CI/CD Pipelines

1. Multi-Stage Pipelines (Dev → Test → Prod)

The first principle of modern deployments is structured promotion across environments. Instead of pushing code directly into production, pipelines should flow through:

  • Development – where code is built and validated.
  • Testing / QA – where integration, regression, and performance testing happen.
  • Production – where only stable, approved builds are deployed.

Each stage should include gates (like automated tests, manual approvals, or compliance checks) to ensure quality. 👉 This prevents untested code from ever reaching end-users and gives teams confidence in every release.

2. Automated Rollbacks with Deployment Slots

Even with the best testing, failures can and do occur. Instead of scrambling with hotfixes, Azure’s deployment slots allow for blue-green deployments or canary releases.

  • Deploy the new version into a staging slot.
  • Run health checks and smoke tests before swapping.
  • If issues are detected post-swap, rollback instantly to the stable version.

👉 This means downtime is minimized, and end-users are rarely exposed to critical errors.

3. Environment Variables & Feature Flags

One of the most common mistakes in deployments is hardcoding environment-specific values. Azure offers tools like App Configuration and Key Vault to securely manage settings across environments.

  • A single codebase can adapt to Dev, Test, and Prod using environment variables.
  • Feature flags allow teams to control functionality dynamically:

👉 This approach makes deployments safer, more flexible, and faster to recover from mistakes.

4. Testing Gates: Building Quality In

Modern CI/CD pipelines are not just about speed—they’re about building quality assurance into every step. Before any code is promoted, it should pass through automated testing gates:

  • Unit Tests – Validate individual functions and methods.
  • Integration Tests – Ensure services, APIs, and databases communicate correctly.
  • Security Scans – Identify vulnerabilities early (e.g., dependency scanning, OWASP checks).
  • Performance Tests (optional) – Catch scaling issues before production traffic hits.

👉 These gates act as a safety net, reducing the chances of defects slipping into production.

5. Monitoring Hooks & Observability

Deployment doesn’t end when code goes live—it continues with monitoring and feedback loops.

Integrating Azure Monitor and Application Insights into the pipeline gives teams real-time visibility into:

  • Deployment success/failure rates
  • Application health metrics (response times, error rates)
  • User impact during or after deployments

Advanced setups can even halt rollouts automatically if metrics degrade, preventing widespread outages.

👉 This transforms deployments from risky “big bang” events into predictable, observable processes.

🏁 Why CI/CD is the Foundation of Modern Software Delivery

Without CI/CD:

  • Releases are manual, inconsistent, and risky.
  • Teams face downtime, missed deadlines, and higher operational costs.
  • Business agility is lost because software updates take too long.

With CI/CD:

  • Releases are fast, repeatable, and safe.
  • Failures are handled gracefully through automation and rollback.
  • Teams can focus on building features instead of firefighting deployments.
  • Businesses achieve faster time-to-market while maintaining quality.

In short: CI/CD pipelines are not just a DevOps practice—they are a business enabler.

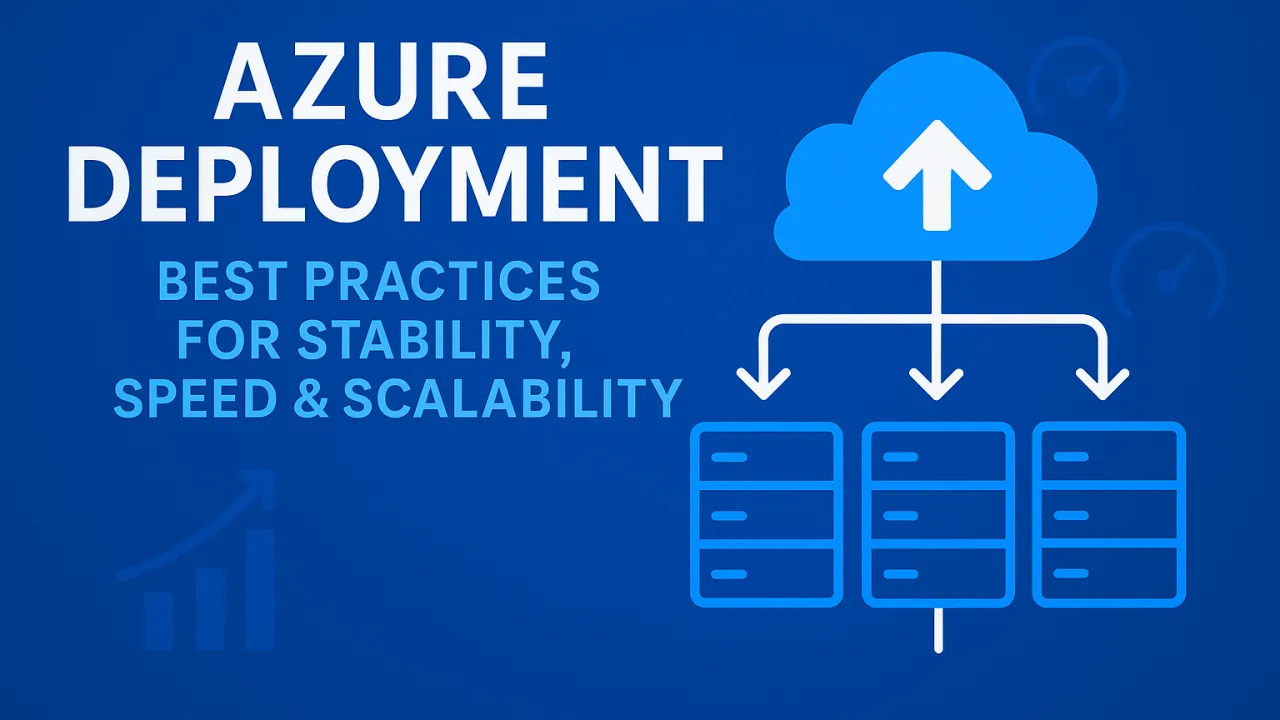
Azure Deployment: Best Practices for Stability, Speed & Scalability

In today’s digital-first world, deploying applications on Microsoft Azure is more than just “pushing code to the cloud.” Successful deployment requires a strategic balance of stability, speed, and scalability. Whether you’re building a small web app or running a global enterprise workload, following proven deployment best practices ensures higher availability, faster performance, and smoother user experiences.

1. Stability – Ensuring Reliability in Every Deployment

A stable deployment means that your application performs consistently without downtime or unexpected issues. On Azure, stability can be achieved through:

a) Infrastructure as Code (IaC)

  • Use Azure Resource Manager (ARM) templates, Bicep, or Terraform to define infrastructure consistently.
  • Automating infrastructure ensures repeatable deployments and reduces human error.

b) Blue-Green & Canary Deployments

  • Blue-Green: Run two environments in parallel (Blue = current, Green = new). Switch traffic only after testing Green.
  • Canary: Release updates gradually to a small portion of users before rolling out globally.

c) Monitoring & Logging

  • Use Azure Monitor, Application Insights, and Log Analytics for real-time visibility.
  • Implement alerts for error rates, latency, and unusual traffic patterns.

d) Disaster Recovery (DR) & Backups

  • Leverage Azure Site Recovery and Geo-redundant storage (GRS).
  • Regular snapshots and automated backup policies protect from unexpected failures.

2. Speed – Faster Deployments, Faster Releases

Speed is not just about deployment time—it’s about how quickly you can ship reliable features without downtime.

a) CI/CD Pipelines

  • Implement Azure DevOps Pipelines or GitHub Actions for continuous integration and delivery.
  • Automate builds, tests, and deployments for faster cycles.

b) Containerization & Serverless

  • Use Azure Kubernetes Service (AKS) for containerized workloads.
  • Deploy serverless functions with Azure Functions to reduce overhead and speed up scaling.

c) Parallel Deployments

  • Deploy multiple services independently using microservices architecture.
  • Avoid bottlenecks by isolating deployment lifecycles of critical services.

d) Testing in Pre-production Environments

  • Use staging slots in Azure App Service for testing before swapping into production.
  • Validate speed and performance before end-users are impacted.

3. Scalability – Growing Without Limits

Azure’s global cloud infrastructure enables scaling applications from 10 users to millions. To achieve seamless scalability:

a) Auto-Scaling

  • Configure Azure Autoscale rules based on CPU, memory, or custom metrics.
  • Scale up (increase resources per instance) or out (add more instances).

b) Load Balancing

  • Use Azure Load Balancer or Application Gateway to distribute traffic.
  • Implement Traffic Manager for geo-distribution, directing users to the closest Azure region.

c) Database Scaling

  • Opt for Azure SQL Database Elastic Pools or Cosmos DB for high-scale scenarios.
  • Use read replicas and caching for faster data access.

d) Event-Driven Architectures

  • Integrate Azure Event Grid, Service Bus, and Event Hubs for scalable communication.
  • Asynchronous processing reduces bottlenecks and supports higher workloads.

4. Security – The Backbone of Stability & Scalability

Without security, deployment practices are incomplete. Azure provides multiple security tools:

  • Azure Key Vault: Securely store secrets, API keys, and certificates.
  • Managed Identities: Reduce password-based authentication risks.
  • Zero Trust Principles: Enforce least-privilege access with Azure Active Directory (AD) and conditional access.
  • DDoS Protection: Protect apps from unexpected traffic surges.

5. Cost Optimization – Speed & Scale Without Wasting Resources

Scaling fast without controlling costs can hurt long-term efficiency. Best practices include:

  • Use Azure Advisor to get recommendations on underutilized resources.
  • Apply Reserved Instances and Spot VMs for predictable workloads.
  • Leverage serverless consumption plans for event-driven apps to pay only for usage.

Final Thoughts

Deploying on Azure is not just about launching apps—it’s about building resilient, high-performing, and scalable solutions that can adapt to user demands in real-time.

By following IaC, CI/CD pipelines, auto-scaling, global traffic management, and security best practices, organizations can unlock the true power of Azure.

In the long run, a well-structured Azure deployment strategy ensures: ✅ Stability – No downtime, smooth rollbacks, and disaster recovery. ✅ Speed – Faster release cycles and reduced deployment friction. ✅ Scalability – Seamless growth from startup to enterprise scale.