

In modern distributed systems, performance problems rarely announce themselves clearly. A slow request might be caused by a downstream service, a database bottleneck, thread starvation, memory pressure, or network latency. Without proper visibility, diagnosing such issues becomes guesswork.
This is where observability becomes essential.
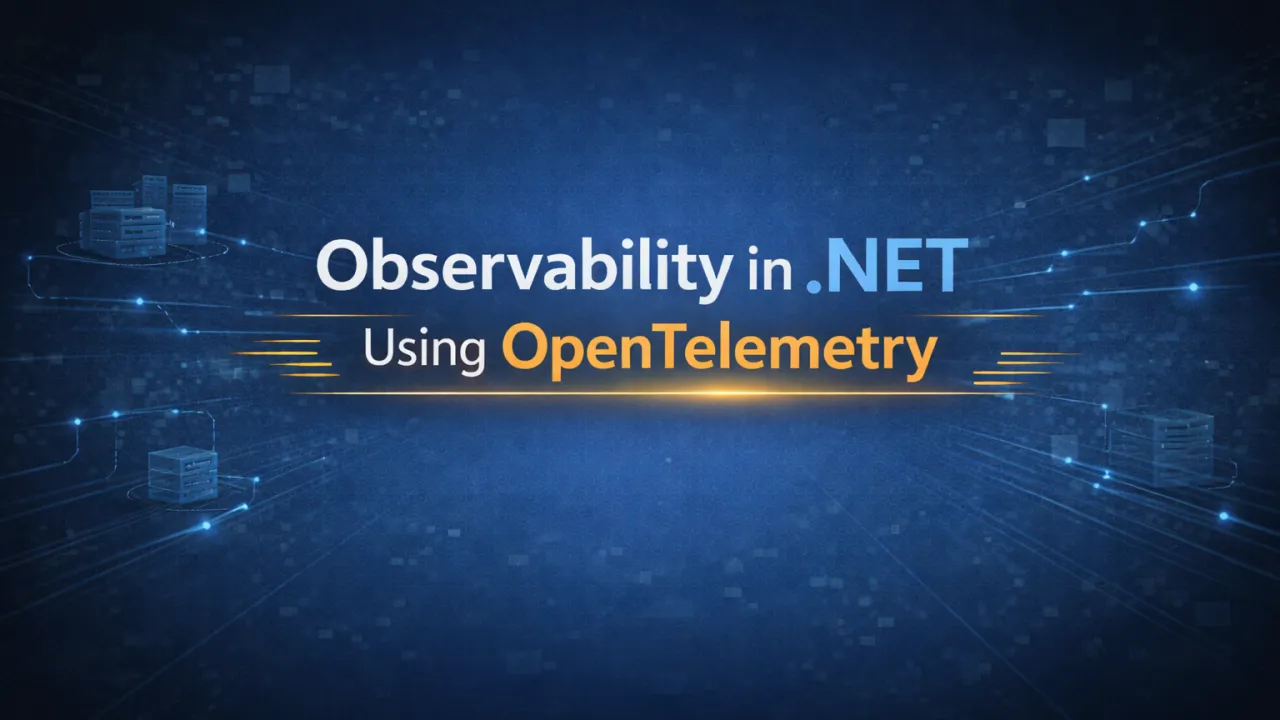
Observability is not just logging. It is the ability to understand what your system is doing internally by analyzing three core signals: logs, traces, and metrics. In the .NET ecosystem, OpenTelemetry has become the standard approach for implementing unified observability across services.
Why Observability Matters in Distributed .NET Systems
As applications evolve into microservices and cloud-native architectures, traditional debugging methods no longer work. You cannot simply attach a debugger in production. Failures span multiple services, and performance degradation often occurs under load.
Observability enables you to:
- Identify latency bottlenecks • Trace request flow across services • Detect abnormal memory or CPU patterns • Monitor error rates and failure spikes • Correlate issues across distributed components
Without observability, scaling safely becomes nearly impossible.
The Three Pillars: Logs, Traces, Metrics
1️⃣ Logs
Logs provide detailed event-level information. They capture application behavior, warnings, errors, and contextual data. Structured logging is critical — plain text logs limit analysis capabilities.
2️⃣ Traces
Traces follow a request’s journey across multiple services. In distributed .NET systems, a single HTTP request may trigger database queries, external API calls, and background jobs. Distributed tracing connects these operations under a shared correlation ID.
3️⃣ Metrics
Metrics provide aggregated numerical insights over time. Examples include request duration, CPU usage, memory consumption, GC collections, and request-per-second counts. Metrics help detect trends and anomalies quickly.
Each signal answers a different question:
- Logs explain what happened
- Traces show where it happened
- Metrics reveal how often and how severe
Together, they provide full visibility.
OpenTelemetry in .NET
OpenTelemetry standardizes how telemetry data is collected and exported. Instead of using disconnected monitoring tools, developers can instrument applications once and export data to multiple observability platforms.
In .NET, OpenTelemetry integrates seamlessly with:
- ASP.NET Core request pipelines • HttpClient calls • Database operations • Background services • Custom application logic
It allows automatic instrumentation while also supporting manual tracing for critical operations.
This unified model reduces vendor lock-in and promotes consistent monitoring practices across services.
Best Practices for Production Observability
Simply enabling logging is not enough. Production-ready observability requires discipline:
- Use structured logging with contextual properties • Ensure trace propagation across service boundaries • Monitor high-value metrics like P95 latency and error rates • Avoid excessive log verbosity in high-traffic systems • Set alerts based on meaningful thresholds • Continuously review telemetry under load
Observability should be proactive, not reactive.
The Strategic Advantage
Teams that implement strong observability resolve incidents faster, scale more confidently, and maintain higher reliability. Instead of reacting blindly to production issues, they rely on measurable system signals.
In modern .NET architecture, observability is not an optional enhancement. It is a foundational requirement for building resilient, high-performance distributed systems.
You cannot optimize what you cannot measure. And you cannot measure what you cannot observe.