

Cloud adoption has transformed how applications are deployed and scaled, but it has also introduced new complexities. In Microsoft Azure, applications are often distributed across multiple services — from Azure App Service and Virtual Machines to Kubernetes clusters and serverless functions. With this complexity, monitoring becomes the backbone of reliability, ensuring that deployments remain healthy, performant, and cost-efficient.
Monitoring is no longer just about checking uptime; it’s about tracking key metrics, identifying anomalies in real time, and proactively addressing issues before they impact end users. Azure provides a rich ecosystem of tools and services that empower developers, DevOps teams, and businesses to achieve just that.
Key Metrics to Track in Azure Deployments
Monitoring is most effective when you know what to measure. Some of the critical categories include:
- Availability Metrics
- Performance Metrics
- Resource Utilization Metrics
- Application-Specific Metrics
Tracking these metrics consistently provides visibility into system health and user experience, while also optimizing cloud spending by avoiding over- or under-provisioned resources.
Core Azure Monitoring Tools
Azure provides a tightly integrated toolset for monitoring every layer of your deployment, from infrastructure to application code.
1. Azure Monitor
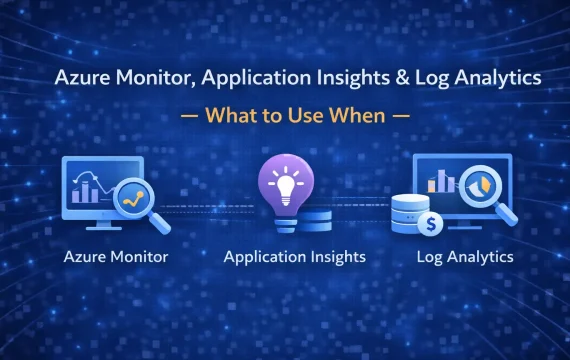
Azure Monitor acts as the central hub for observability in Azure. It collects data from VMs, containers, databases, and PaaS resources, consolidating it into dashboards and logs. Its key strengths are:
- Unified metrics and log collection across the Azure ecosystem.
- Integration with alerting systems for proactive notifications.
- Custom dashboards to visualize KPIs at infrastructure or application level.
2. Application Insights
For developers, Application Insights is the most powerful tool. It provides application performance monitoring (APM), with insights such as:
- Request response times, dependency tracking, and error diagnostics.
- End-to-end transaction tracing, even across microservices.
- Real-time user telemetry, such as session duration and geographic traffic.
- Integration with .NET, Java, Node.js, and Python applications.
This enables teams to catch performance degradations, API slowdowns, and unhandled exceptions quickly.
3. Log Analytics
Log Analytics is the query engine behind Azure Monitor. It allows teams to dig deep into telemetry data with Kusto Query Language (KQL). Examples include:
- Analyzing patterns in failed logins for security monitoring.
- Detecting anomalies in request rates.
- Correlating application logs with infrastructure failures.
4. Alerts and Dashboards
To make monitoring actionable, Azure enables:
- Automated alerts that trigger based on thresholds (e.g., CPU > 80%, error rate > 5%).
- Smart alerts powered by machine learning to detect unusual patterns.
- Custom dashboards for NOC (Network Operations Center) or DevOps teams.
This ensures that issues are identified before customers notice them, reducing downtime and improving SLA adherence.
Best Practices for Developers and Teams
Monitoring tools are only effective if paired with best practices:
- Define SLIs, SLOs, and SLAs: Service Level Indicators (SLIs) and Objectives (SLOs) guide what metrics matter most. For example, “99.9% uptime” may translate into strict error-rate and latency monitoring.
- Integrate monitoring with CI/CD pipelines: Ensuring every new deployment is validated with synthetic tests and telemetry integration.
- Tag and organize resources: Proper resource tagging improves observability across environments (dev, test, production).
- Enable distributed tracing: Especially critical in microservices and serverless architectures.
- Set proactive alerts: Don’t wait for customer complaints — configure alerts for unusual traffic spikes, error surges, or resource drains.
When Things Go Wrong: Root Cause Analysis
No deployment is perfect, and failures are inevitable. Monitoring helps reduce MTTR (Mean Time to Recovery) by:
- Correlating application failures with infrastructure events.
- Identifying whether an issue stems from code changes, external dependencies, or resource exhaustion.
- Providing developers with full visibility into the chain of events leading to downtime.
This accelerates incident resolution and fosters a culture of continuous improvement.
Conclusion
In today’s cloud-driven ecosystem, monitoring is more than an operational requirement; it is a strategic advantage. With Azure Monitor, Application Insights, and Log Analytics, organizations gain comprehensive visibility into system health, performance, and user experience.
By tracking the right metrics, adopting best practices, and integrating monitoring into the DevOps lifecycle, teams can transform their Azure deployments from reactive to proactive — delivering reliable, scalable, and high-performing applications that meet user expectations and business goals.